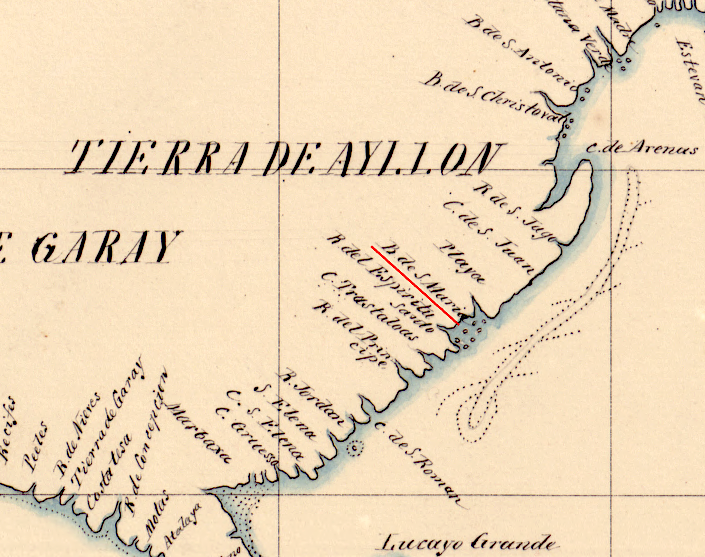
The word "Chesapeake" may have referred to an individual Native American town near a "great water." The Native Americans living there, in modern-day Virginia Beach, were known as the Chesapeake tribe
The planned destination for the 1587 colony was the Chesapeake Bay, but ship captains dropped them off at Roanoke Island. Survivors of that colony may have moved north to the territory controlled by the Chesapeakes, near the Lynnhaven/Elizabeth rivers. However, Powhatan expanded his territory and eliminated the entire Chesapeake community about the time Jamestown was settled.
His seizure of the territory may have resulted in the death of any colonists still alive from the 1587 settlement, and of any children of those colonists. The English who arrived starting in 1607 inquired about the fate of the colonists who had been "lost" for 20 years, but never identified any survivors.1
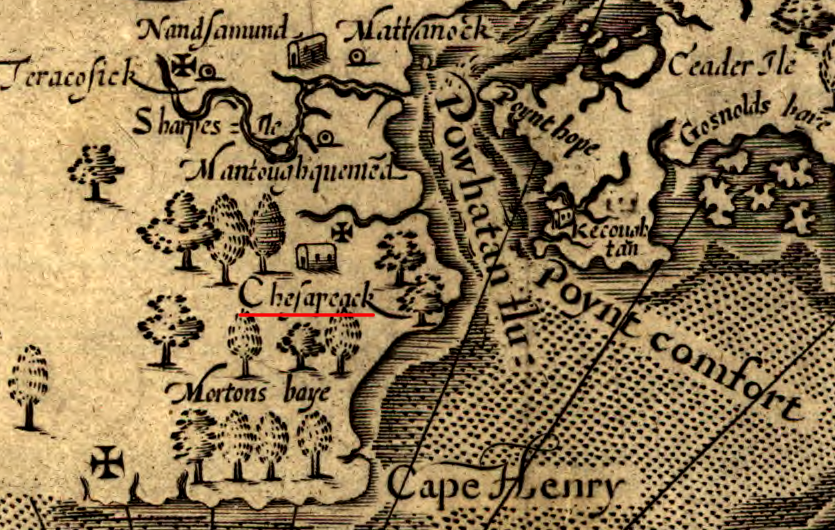
Chesapeake tribe territory (in what is modern Virginia Beach/Norfolk/Portsmouth)
Source: Library of Congress, Virginia (by John Smith, 1624)
There is a long-standing tradition that the word Chesapeake means Great Shellfish Bay. That claim is not supported by the research of Blair Rudes, a linguist who re-studied the Algonquian language for a Hollywood movie The New World. Whether the name means Great Water, Great Shellfish Bay, Extraodinary Protein Factory, or something else, the Chesapeake Bay has been an major source of food since it was created by sea level rise over the last 10,000 years.2
In 1608, John Smith discovered the bay was so rich in fish (perhaps menhaden) that his men tried catching them with frying pans:3
...we found, and in divers places that aboundance of fish, lying so thicke with their heads above the water, as for want of nets (our barge driving amongst them) we attempted to catch them with a frying pan: but we found it a bad instrument to catch fish with: neither better fish, more plenty, nor more variety for smal fish, had any of us ever seene in any place so swimming in the water, but they are not to be caught with frying pans...
For Native American societies that hunted and gathered food after the harvest in the Fall, access to the bay was important. It is not surprising that on his 1608 voyage up the bay and some major tributaries, John Smith saw Native American towns surrounded by palisades of tree trunks. The competition between tribes was not always peaceful; the protein resources of the bay were worth a fight.
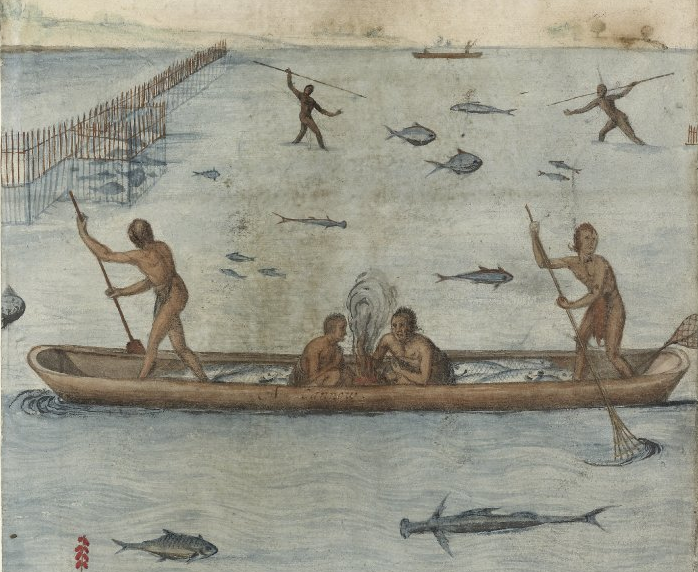
fish provided protein to Native Americans along the Atlantic shoreline and in the Chesapeake Bay, but the English still starved in 1607-10
Source: British Museum, The manner of their fishing (by John White, 1585-1593)
Despite having a river filled with seafood at the edge of their fort, the freshly-arrived English managed to starve to death in Jamestown. Later colonial Virginians made far better use of the protein in the bay.
George Washington, for example, made a good profit from having his slaves seine herring in the Potomac River off the shores of Mount Vernon. He would preserve the fish in barrels with salt and sell them as food that could be carried back to Europe - or sold for the slaves in the Caribbean Islands, where most of the land was dedicated to growing sugar cane and food was imported (including much pork from Norfolk).4
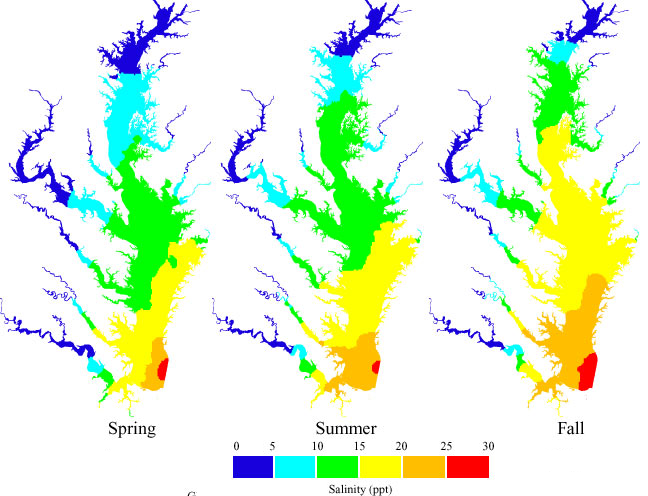
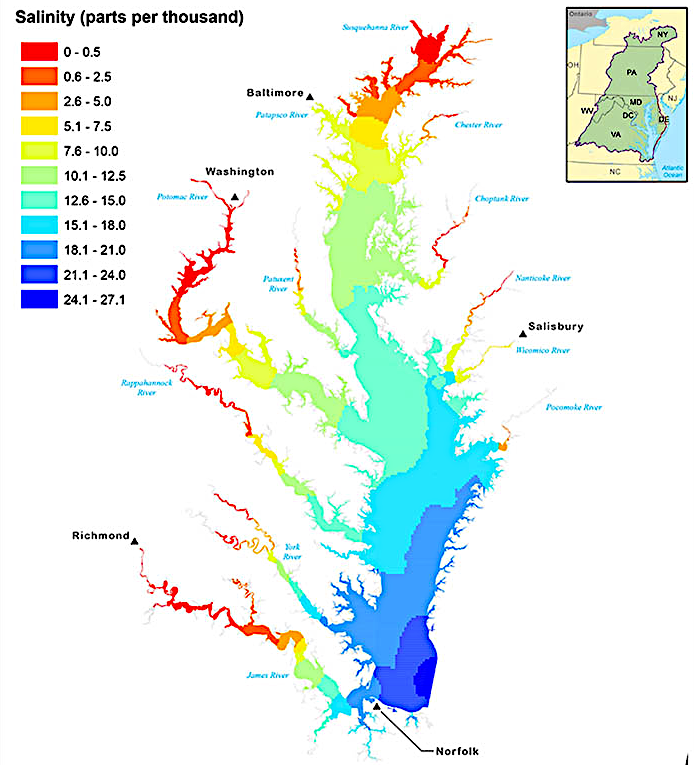
The Chesapeake Bay, the largest in the United States according to the Environmental Protection Agency (EPA) and one of the largest in the world, is a rich protein resource. It generates oysters, clams, crabs, and fish in part because of the mixture of salt water from the ocean and fresh water from various rivers. The salinity of the open Atlantic Ocean is 35 parts per thousand (ppt). In the Chesapeake Bay, fresh water flowing off the land dilutes the salt water entering from the ocean, creating a brackish estuary.
Salinity is the key difference between a fresh water lake/river, an estuary, and the ocean. In an "estuary," fresh and salt water mingle together to create a special environment that is highly productive biologically. Marine fish, species who can live in brackish water (with salinity between 0.5-35 parts per thousand) and freshwater species both take advantage of the estuary. In addition, numerous plant and animal species have specialized over the centuries to thrive in the brackish water.
Salinity varies from 27ppt at the mouth of the bay to 0.5ppt several miles below the Fall Line, as measured on the surface. Salt water is heavier than fresh water, so salinity measurements taken near the bottom of the bay or a tributary river will record that deeper water is saltier water. Except in droughts when river flow is diminished, fresh water (less than 0.5ppt) can extend on the surface of the Potomac River down to Mason Neck.5
salinity in the Chesapeake Bay varies by season and location, with the freshest water being in the northern portion (within Maryland) during the Spring
Source: Maryland Department of Natural Resources, Eyes on the Bay Lesson Plans
Biological productivity as well as biodiversity is high in the Chesapeake Bay. Photosynthesis in an acre of Chesapeake Bay salt marsh can easily surpass the productivity of any Virginia farm in the Shenandoah Valley. Humans prefer to eat corn on the cob rather than marsh grasses, of course, so few of us normally think of salt water marshes as more valuable than corn fields. Humans may be picky eaters, but the decaying grasses are a great food source for the microscopic zooplankton in the water.
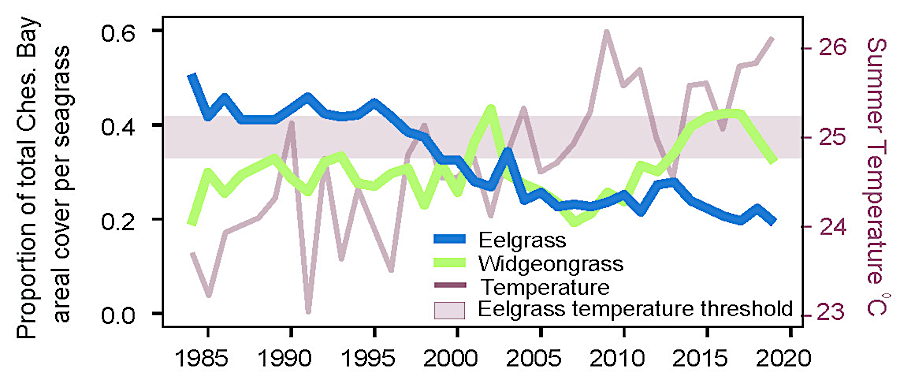
One impact of heatwaves has been the increase of widgeongrass (Ruppia maritima) and the decline of eelgrass (Zostera marina). Widgeongrass survives the higher water temperature, and is now the dominant species growing on submerged land in the bay. Its range expansion was facilitated by having longer-lasting seeds, allowing for quicker occupation of habitat after disturbance.
The shorter, thinner blades of widgeongrass make it more vulnerable than eelgrass to cloudy water when spring runoff carries sediment to the bay. The decline of eelgrass and the expansion of widgeongrass make populations of grass-dependent species such as blue crabs more vulnerable. Die-off of widgeongrass after periods of high sediment runoff can result in more rapid habitat change across a wider area.6
Decaying marsh grasses provide the organic material at the base of the detritus food pyramid. Big fish at the top of the food chain eat little fish.
Lower down on the food chain, little fish eat invertebrates, and invertebrates eat detritus - the decomposing plant material with microorganisms consuming the vegetation, at the bottom of the food chain.
The submerged grasses create especially valuable habitat, and are sensitive to pollution. The zooplankton, snails, small fish, birds, and larger fish that feed on each other in a hierarchy of life (and death) can not exist if the Submerged Aquatic Vegetation (SAV), the meadows of underwater grasses, disappear.7
The biological productivity of the bay is enhanced by its shape. The Chesapeake Bay is the largest of the 130 estuaries in the United States, and in North America second only to the Gulf of St. Lawrence in Canada. The Chesapeake Bay is about 200 miles long and very shallow, averaging only 21 feet in depth (when including the tidal portion of its tributaries). The bay has an extraordinary amount of shoreline - over 11,600 miles, more than the Pacific Ocean shoreline on the entire West Coast of the United States from Canada to Mexico.8
The vast amount of life in the bay was triggered in part by that large amount of ecological "edge" where the land meets the sea, plus the ability of sunlight to reach the bottom across much of the shallow bay. The depths at which Submerged Aquatic Vegetation will grow in the tidal waters of Virginia and Maryland is limited by wave action in the shallow end (the roots can't hold the plants in one place, if the water is sloshing around with too much energy) and by light penetration in the deep end (the deeper the water, the less light at the bottom). Submerged aquatic vegetation provided food and shelter for microscopic zooplankton, blue crabs, and other wildlife while oysters grew in such quantity that their old shells piled up into bars that obstructed navigation.
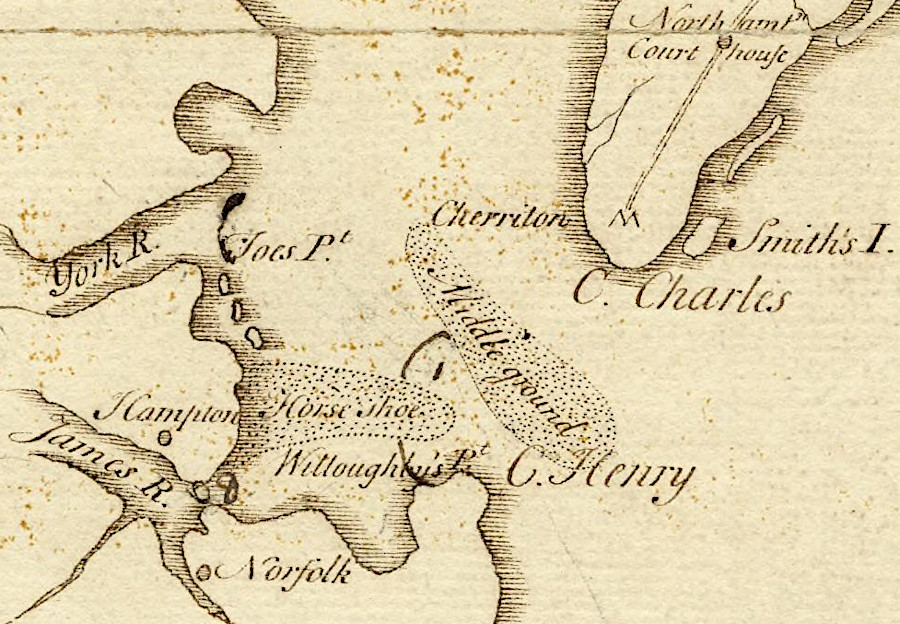
Horseshoe and Middle ground shoals are located near the mouth of the Chesapeake Bay
Source: University of Michigan, William L. Clements Library, Delaware Bay and Chesapeake Bay (1781)
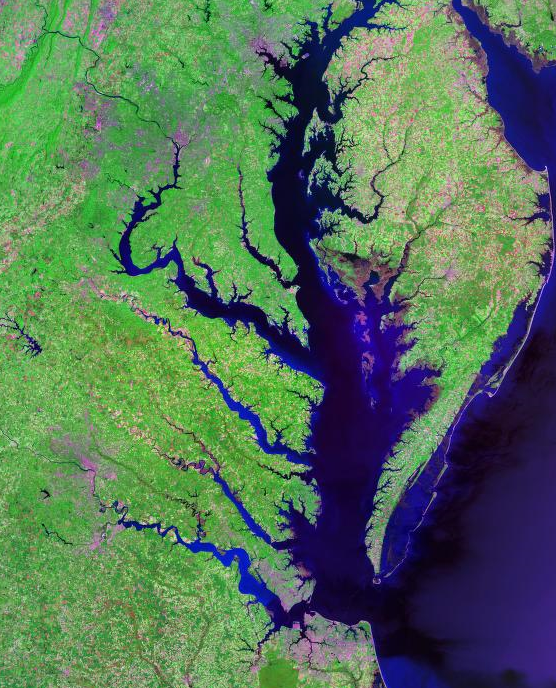
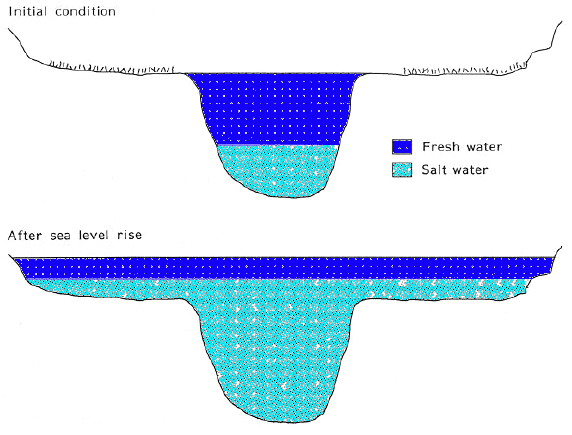
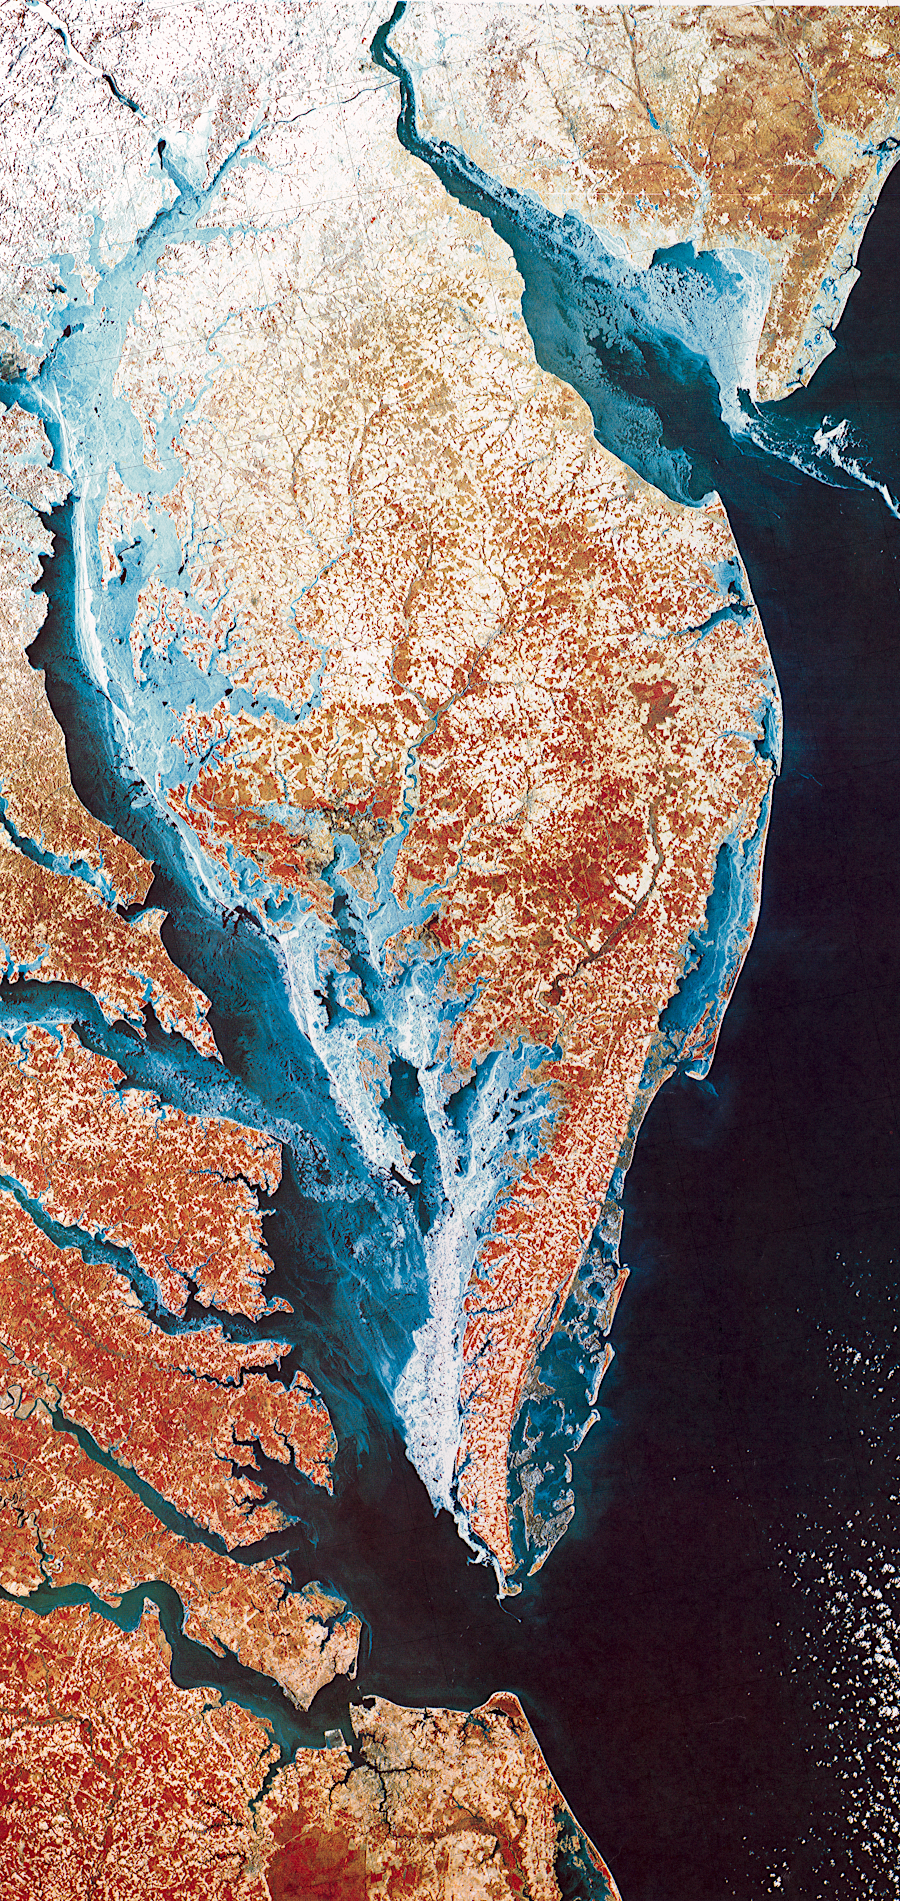
The Chesapeake Bay is a recent feature in the Virginia landscape. When the glaciers started to melt faster than they grew at the end of the last ice age 18,000 years ago, the volume of liquid water on earth increased significantly. Rising sea levels flooded first the continental shelf, and then the river valleys of the Susquehanna and James rivers. As the last ice sheet retreated, ocean currents brought sediments from the Delaware River south, extending the length of the Eastern Shore and blocking the direct path of the Susquehanna River.
The Chesapeake Bay did not exist until about 9-10,000 years ago, when the rising Atlantic Ocean finally covered the Continental Shelf and began to drown the separate channels of the Susquehanna and James river valleys. Its geologic youth is typical; most estuaries are less than 10,000 years old.9
rising sea levels drowned the valleys of the Susquehanna and other rivers to form the Chesapeake Bay, and saltwater covered the former riverbank floodplains
Source: Greenhouse Effect, Sea Level Rise, and Land Use
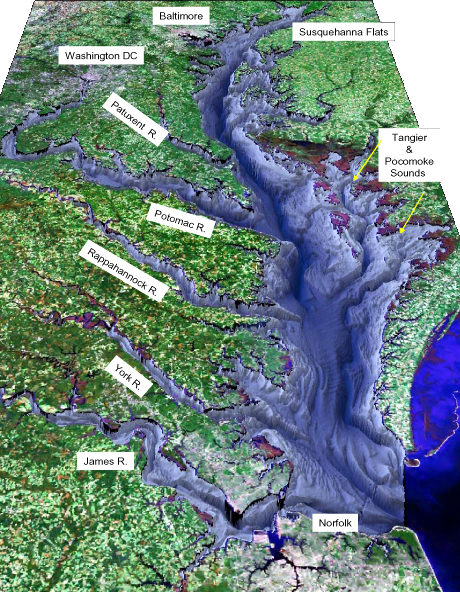
The bay grew from south to north for those 9-10,000 years, as sea level rose and flooded the mouths of the Susquehanna and James rivers, then the mouths of the York, Rappahannock, Potomac, and Patuxent rivers further north. About 3,000 years ago, the Chesapeake Bay finally looked like what we see today. The existing size and shape of the Chesapeake Bay has been altered only slightly by natural forces - and some Corps of Engineers projects - in the last 3,000 years.10
Native Americans have been in Virginia for 15,000 or so years. That means humans saw the Virginia shoreline change dramatically as the rising seas first flooded the continental shelf, then flooded the channel of the Susquehanna River to form the Chesapeake Bay. The first Virginia immigrants had to move up the hillsides as the landscape evolved and the Chesapeake Bay developed.
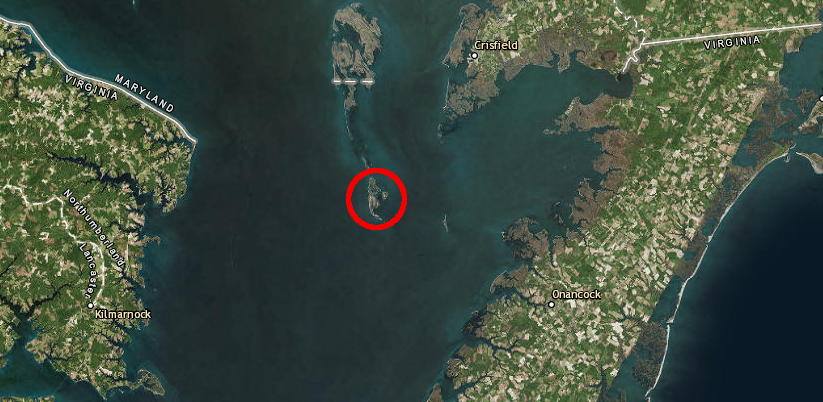
Current residents of Tangier Island face the same challenge, because sea levels continue to rise. News articles in Virginia media regularly highlight the challenge faced by the remaining 500 residents of that island, which is predicted to become an underwater sandbar rather than an inhabited island within the next 50-100 years.11
residents living on Tangier Island will be forced to abandon it over the next 50-100 years if sea levels continue to rise
Source: ESRI, ArcGIS Online
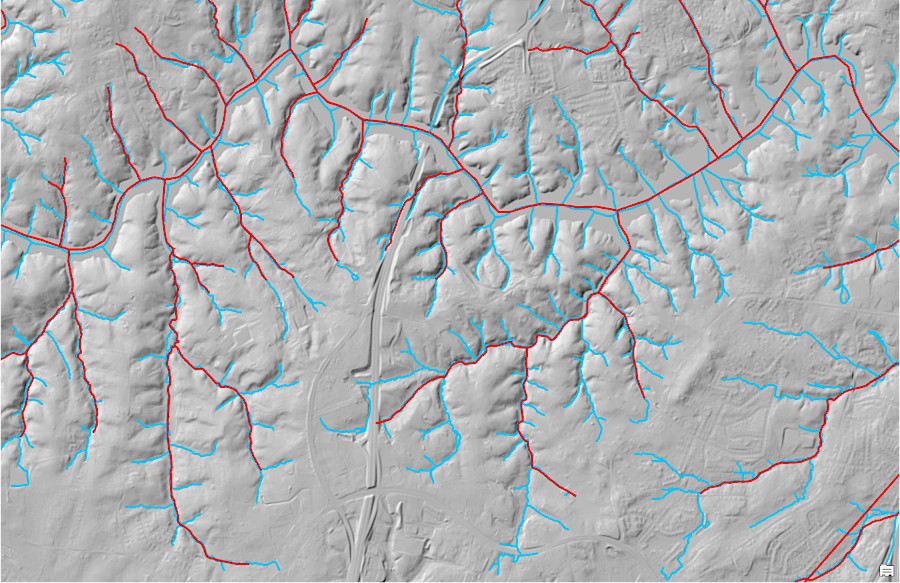
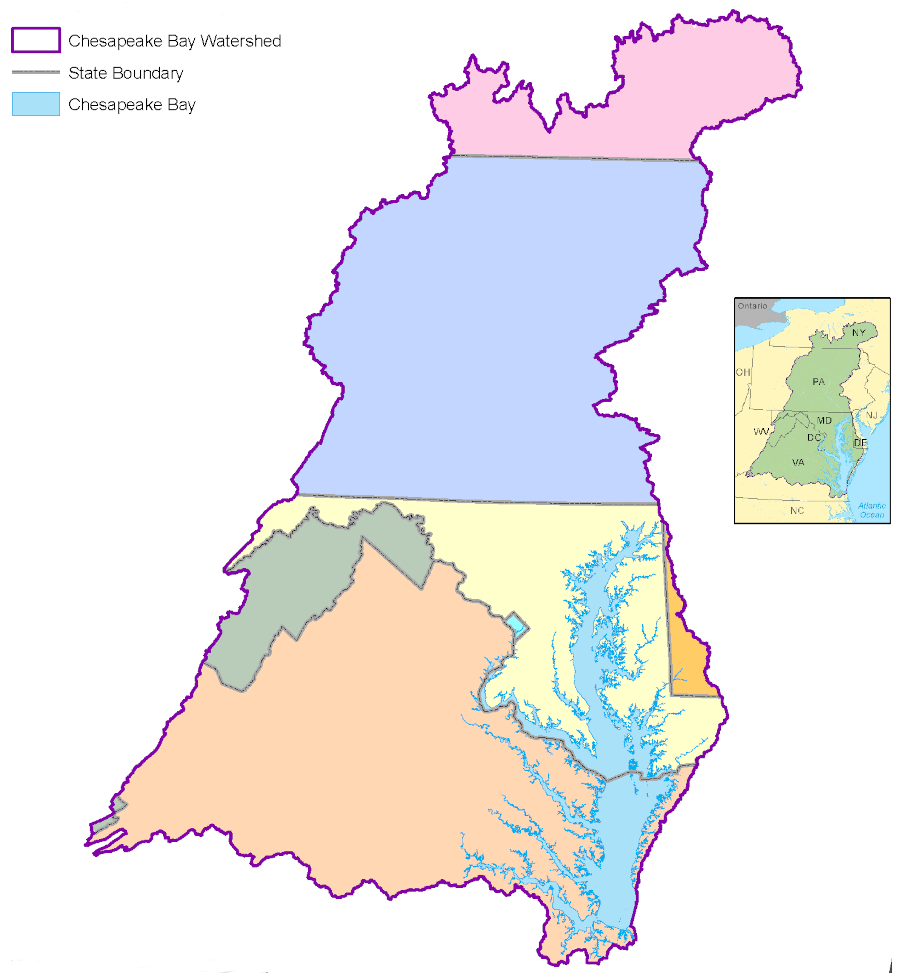
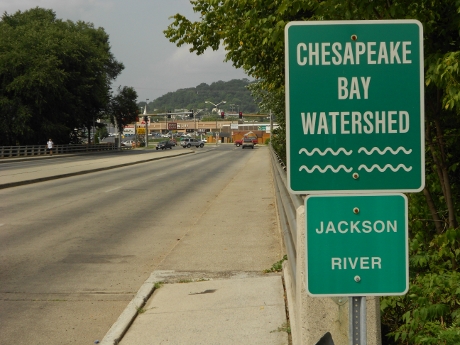
Protecting the quality of the water in the Chesapeake Bay requires protecting the quality of the water that flows in the streams across the 64,000 square miles of the bay's watershed. In 2025, high-resolution LiDAR data and artificial intelligence was used to create a new map of the natural channels in the watershed. The new map doubled the number of stream miles identified by using just aerial photography from 100,000 to 200,000 miles.
As a University of Maryland geography professor noted:12
The landscape is shaped by running water. Stream networks are the primary conduit between the watershed and the Bay.
Modern scorecards to measure the bay's health have to use a baseline to define "healthy." Many references to "Save the Bay" initiatives are based on the assumption that the bay was healthy in 1600, so that is an appropriate base line for assessing restoration to the historic condition.
The biological conditions of the bay have changed far more than the geological setting in the last four centuries. The stocks of seafood could recover easily from the minor impacts of Native American/early colonial harvests, but the impacts of modern fishing, clamming, oystering, and crab harvests in the last century have reduced populations dramatically. New species have been introduced, and the balance between species has been altered. The physical conditions of the sediments and water in the bay have been changed forever, and 17 million people living in the watershed continue to contribute various forms of pollution every day.
Though restoration efforts for oysters and other species are underway, the bay will never return to its original condition. The states and District of Columbia failed to reduce pollution sufficiently to meet the minimum standards of the Clean Water Act, despite 25 years of synchronized promises dating back to the 1983 Chesapeake Bay Agreement (which was signed on the George Mason University Fairfax campus). That led to mandatory requirements, imposed by a Federal judge and negotiated with the states by the Environmental Protection Agency under President Obama.
In May 2009, President Obama issued the Chesapeake Bay Protection and Restoration Executive Order defining a leadership role for the Federal government. In 2010, a Federal court ordered the Environmental Protection Agency to complete a Total Maximum Daily Load (TMDL) study and establish pollution limits.
The estimated cost for Virginia to comply with the TMDL limits by 2025 was $15 billion. Not surprisingly, the state missed the deadline.13
The election of President Trump in 2016 raised doubts about the Federal government's commitment to require compliance with the water quality standards in the Clean Water Act, and to force the states to complete their Watershed Implementation Plans as required by the TMDL. However, funding continued during the first Trump Administration and through the subsequent Biden Administration.
The first budget of the second Trump Administration proposed dramatic reductions in funding for the agencies that supported the Chesapeake Bay Program - Environmental Protection Agency (EPA), National Oceanic and Atmospheric Administration (NOAA), U.S. Geological Survey (USGS) - plus U.S. Department of Agriculture (USDA) funding for conservation projects by farmers that reduce nitrogen, phsphorous, and sediment flow into the bay. The US Congress supported only some of those reductions.14
cover sheet of Chesapeake Bay Total Maximum Daily Load (TMDL)
Source: Environmental Protection Agency (EPA), Chesapeake Bay TMDL Document

