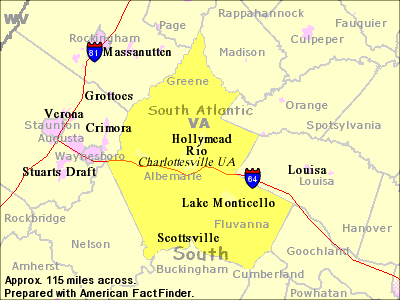
Charlottesville Metropolitan Statistical Area

[NOTE: 1990 Demographic Profile from the American Fact Finder - Community Profiles.
D-2. Social Characteristics: 1990
Geographic Area: Charlottesville, VA MSA
Subject |
Number |
| URBAN AND RURAL RESIDENCE | |
| Total population | 131,107 |
| Urban population | 70,246 |
| Rural population | 60,861 |
| Farm population | 2,291 |
| SCHOOL ENROLLMENT | |
| Persons 3 years and over enrolled in school | 41,486 |
| Preprimary school | 2,508 |
| Elementary or high school | 17,851 |
| Percent in private school | 7.2 |
| College | 21,127 |
| EDUCATIONAL ATTAINMENT | |
| Persons 25 years and over | 80,658 |
| Less than 9th grade | 8,845 |
| 9th to 12th grade, no diploma | 9,749 |
| High school graduate | 18,341 |
| Some college, no degree | 12,793 |
| Associate degree | 4,086 |
| Bachelor's degree | 14,839 |
| Graduate or professional degree | 12,005 |
| Percent high school graduate or higher | 76.9 |
| Percent bachelor's degree or higher | 33.3 |
| RESIDENCE IN 1985 | |
| Persons 5 years and over | 122,215 |
| Lived in same house | 53,528 |
| Lived in different house in U.S. | 66,620 |
| Same state | 46,171 |
| Same county | 18,938 |
| Different county | 27,233 |
| Different state | 20,449 |
| Lived abroad | 2,067 |
| DISABILITY OF CIVILIAN NONINSTITUTIONALIZED PERSONS | |
| Persons 16 to 64 years | 90,417 |
| With a mobility or self-care limitation | 3,047 |
| With a mobility limitation | 1,228 |
| With a self-care limitation | 2,453 |
| With a work disability | 5,200 |
| In labor force | 2,435 |
| Prevented from working | 2,297 |
| Persons 65 years and over | 13,059 |
| With a mobility or self-care limitation | 2,439 |
| With a mobility limitation | 1,925 |
| With a self-care limitation | 1,365 |
| CHILDREN EVER BORN PER 1,000 WOMEN | |
| Women 15 to 24 years | 160 |
| Women 25 to 34 years | 1,003 |
| Women 35 to 44 years | 1,672 |
| VETERAN STATUS | |
| Civilian veterans 16 years and over | 12,757 |
| 65 years and over | 3,284 |
| NATIVITY AND PLACE OF BIRTH | |
| Total population | 131,107 |
| Native population | 126,483 |
| Percent born in state of residence | 60.6 |
| Foreign-born population | 4,624 |
| Entered the U.S. 1980 to 1990 | 1,975 |
| LANGUAGE SPOKEN AT HOME | |
| Persons 5 years and over | 122,215 |
| Speak a language other than English | 6,247 |
| Do not speak English "very well" | 1,895 |
| Speak Spanish | 1,471 |
| Do not speak English "very well" | 495 |
| Speak Asian or Pacific Island language | 1,527 |
| Do not speak English "very well" | 678 |
| ANCESTRY | |
| Total ancestries reported | 149,226 |
| Arab | 322 |
| Austrian | 432 |
| Belgian | 161 |
| Canadian | 302 |
| Czech | 450 |
| Danish | 525 |
| Dutch | 2,460 |
| English | 27,376 |
| Finnish | 203 |
| French (except Basque) | 3,763 |
| French Canadian | 638 |
| German | 25,817 |
| Greek | 525 |
| Hungarian | 697 |
| Irish | 18,354 |
| Italian | 4,374 |
| Lithuanian | 363 |
| Norwegian | 895 |
| Polish | 2,367 |
| Portuguese | 160 |
| Romanian | 183 |
| Russian | 1,514 |
| Scotch-Irish | 5,244 |
| Scottish | 4,798 |
| Slovak | 576 |
| Subsaharan African | 263 |
| Swedish | 1,707 |
| Swiss | 699 |
| Ukrainian | 366 |
| United States or American | 13,762 |
| Welsh | 1,585 |
| West Indian (excluding Hispanic origin groups) | 221 |
| Yugoslavian | 65 |
| Other ancestries | 28,059 |
| (X) Not applicable Source: U.S. Bureau of the Census, 1990 Census of Population and Housing, Summary Tape File 3 (Sample Data) Matrices P1, P6, P13, P28, P32, P33, P34, P36, P37, P38, P39, P42, P43, P54, P58, P64, P66, P69. NOTE TO ALL DATA USERS: All survey and census results contain measurement error and may contain sampling error. Information about these potential errors is provided or referenced with the data or the source of the data. The Census Bureau recommends that data users incorporate this information into their analyses as these errors could impact inferences. Researchers analyzing data to create their own estimates are responsible for the validity of those estimates and should not cite the Census Bureau as the source of the estimates but only as the source of the core data. We have modified some data to protect individuals' privacy, but in a way that preserves the usefulness of the data. |
|
Population
Virginia Places